
Surface water quality
Surface water quality varies across Tunisia, with the highest quality having salinity less than 1.5 grams per litre (g/L) and representing 72% of surface water potential, to between 1.5 and 3 g/L, representing 22% of surface water potential. The remaining 6% of surface water reserves have the poorest quality, with salinity higher than 3 g/L.[1]
Table 1: Salinity of surface and groundwater resources in relation to total potential water resources (MCM).[2]
| Salinity | <1.5 g/L | >1.5 to <3 g/L | >3 g/L | Total (MCM) |
| Surface water | 1,944 (72%) | 594 (22%) | 162 (6%) | 2,700 |
| groundwater - Shallow aquifers | 58 (8%) | 230 (32%) | 431 (60%) | 719 |
| Groundwater - Deep aquifers | 283 (20%) | 808 (57%) | 326 (23%) | 1,417 |
Groundwater quality
The salination of groundwater has been identified as one of the major contributors to the degradation of Tunisia’s water resources and is expected to be exacerbated by the intensive use and overexploitation of shallow and deep aquifers.[3]
Many shallow aquifers, which make up 60% of the total groundwater resources, have salinity of more than 3 g/L. About one third (32%) of shallow aquifers have salinity between 1.5 and 3 g/L. Only 8% of the resources are of good quality, with salinity less than 1.5 g/L. Of the deep aquifers, about 57% has salinity between 1.5 and 3 g/L and 23% have salinity higher than 3 g/L. About 20% have salinity of less than 1.5 g/L.
Groundwater quality is monitored twice a year by the General Directorate of Water Resources at more than 1,214 points: 736 wells in shallow aquifers and 478 boreholes in deep aquifers.[4]
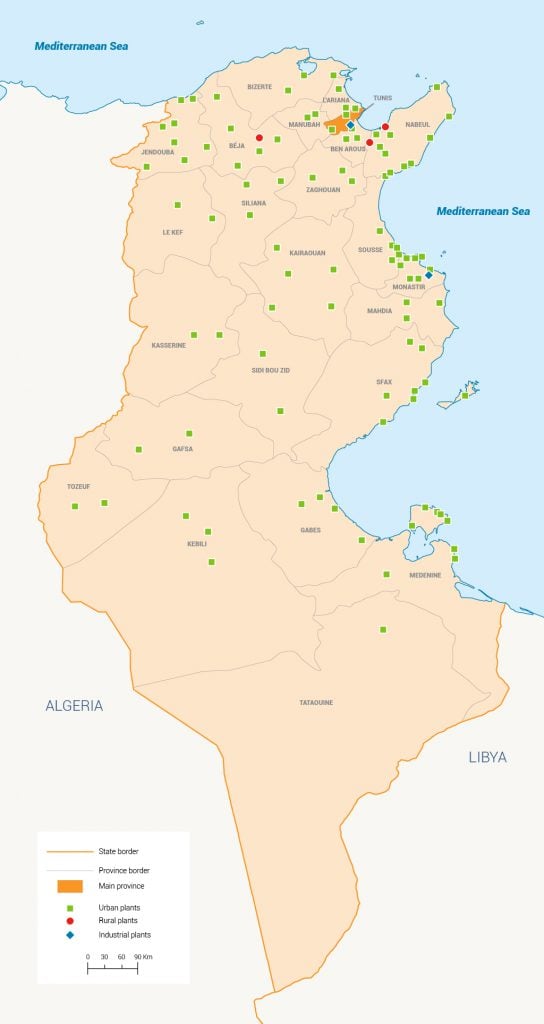
Sanitation and wastewater treatment network
Over the past two decades, the Tunisian government has made major efforts to build wastewater facilities. However, the overall quality of water resources remains at risk and could be negatively impacted by industrial, domestic and irrigation expansion. The sanitation coverage is 85% for all the population versus 96% in urban areas and 65% in rural areas. Less than 60% of polluting industries is connected to sewerage network, and those that are generally do not respect the Tunisian water standards prior to discharging their wastewater into the sewerage system.[5] The remaining industries generate a considerable pollution load by discharging untreated effluents into natural-receiving water bodies, posing major health and pollution threats risks to downstream and underground water resources and to aquatic environments.[6] Some 33% of wastewater treatment plants are overloaded and unable to meet the required treatment levels and capacity.[7]
Environmental and health risks
The main environmental and health risks come from the poor quality of treated wastewater. In 2013, only four wastewater treatment plants had effluents complying with all the thresholds of water-quality parameters regulated by the national standard of reuse [NT 106.03 (1989)], and 80% of wastewater treatment plants had two or more parameters exceeding the maximum threshold value. Epidemics are sometimes recorded, caused mainly by the consumption of water contaminated by disease-causing agents.[8] [9]
Due to the growing water scarcity, coastal and marine ecosystems are also being increasingly threatened by a combination of diffuse pollution from agricultural drainage with inappropriate wastewater discharges, mainly due to overcapacity at several of the existing plants, and inefficient treatment and disposal systems.
Figure 1: Evolution of groundwater withdrawals between 2006 and 2016. [12]
In addition, the overexploitation of groundwater resources has had a negative impact on the surrounding environment in terms of a reduced quantity and quality of groundwater, and seawater intrusion into groundwater aquifers. The water exploitation index, which measures withdrawals of conventional freshwater resources (surface and groundwater) in relation to total renewable resources, increased from 14% in 2014 to 19% in 2015 and 33% in 2016.[10] About 47% of these resources are considered no renewable.[11]
[1] Ministère de l’Environnement et du Développement Durable, n.d. Gestion Durable des Ressources en Eau.
[2] Mamou A, 1993. Principal Outline of National Planning, Environmental Limits 1996.
[3] Earthwise, n.d. Hydrogeology of Tunisia.
[4] Ibid
[5] Hamdy Nour M et al., 2014. Tunisia Water Sector M&E Rapid Assessment Report.
[6] Mediterranean Environmental Technical Assistance Program, n.d. Water Quality Management.
[7] ITES, 2014. Etude Stratégique: Système Hydraulique de la Tunisie à l’Horizon 2030.
[8] Hamed Y et al., 2018. Climate impact on surface and groundwater in North Africa: a global synthesis of findings and recommendations. Euro-Mediterranean Journal for Environmental Integration 3:25.
[9] Hamdy Nour M et al., 2014. Tunisia Water Sector M&E Rapid Assessment Report.
[10] Ministry of Agriculture, Water Resources and Fisheries, 2017. Rapport National du Secteur de l’Eau.
[11] Ibid.
[12] Ibid.
[13] Ibid.