Contributors
Author: The author of this report wishes to remain anonymous. The identity of the author is verified by Fanack Water’s editorial team.
Peer review: Fanack Water Editorial Team
Introduction
Turkey is located in a semi-arid climate zone and is one of the Mediterranean countries most affected by climate change. Indeed, Turkey had its driest year in two decades in 2021. As a result, water resources are protected, developed and managed as a vital strategic asset. In this context, Turkey implements policies aimed at reducing water loss and leakages in all sectors, with a particular focus on mitigating the impact of climate change on water resources and improving water efficiency.
Geography and climate
Turkey has a total area of 78 million hectares (ha).[1] The country is bounded by the Black Sea to the north, Iran, Georgia and Armenia to the east, Syria and Iraq to the south-east, the Mediterranean and Aegean Sea to the south, and Bulgaria and Greece to the north-west.[2]
Some 24 million ha of the total area is agricultural land. The size of the area that can be irrigated with the existing water potential is estimated at 8.5 million ha. As of 2019, 6.65 million ha of land are irrigated.[3]
Turkey’s climate is characterized as semi-arid, although nine climate types can be distinguished: Mediterranean, wet Mediterranean, partially wet Mediterranean, Black Sea, partially wet Marmara, steppe, partially dry central Anatolian, partially dry south-east Anatolian and continental east Anatolian.[4]
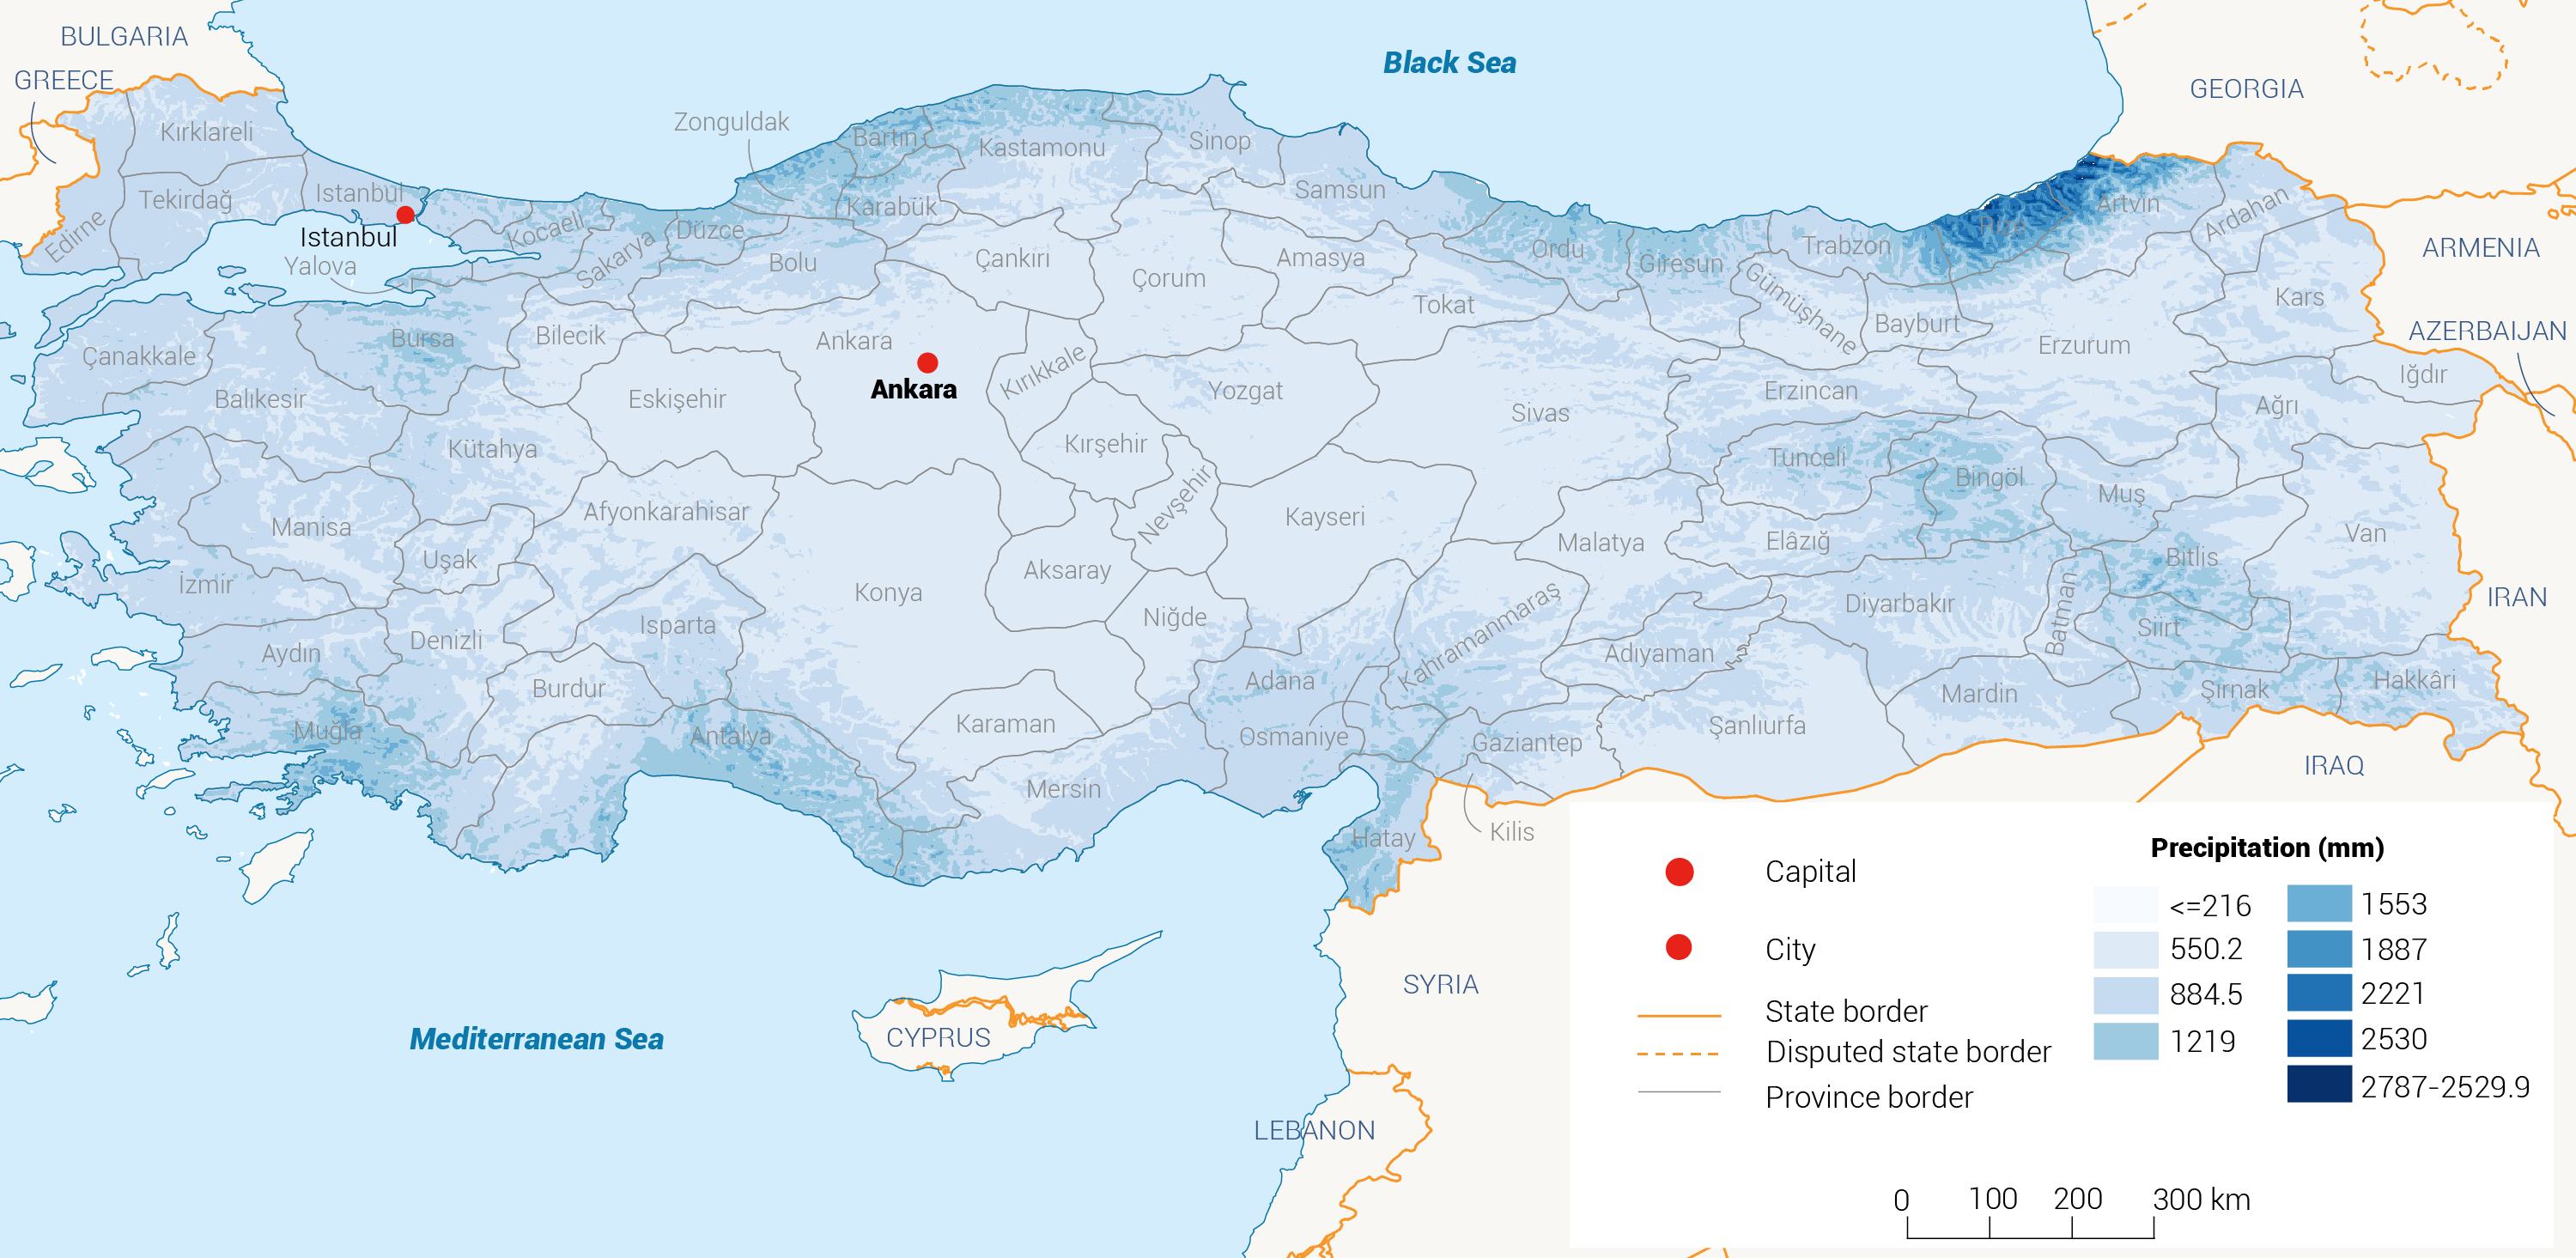
Average annual rainfall is 574 millimetres (mm). Annual precipitation reaches 1,000-2,500 mm in the mountainous coastal regions, with the highest rainfall (1,200-2,500 mm per year) occurring in the Black Sea region. Central Anatolia has the lowest rainfall (250-300 mm) which, combined with high temperatures and evaporation rates, results in drought during the summer months (Map 1).[5]
Population
Turkey’s population was 20.95 million in 1950.[6] By 2021, this number had risen to 84.68 million (Figure 1). In 2021, 93.2% of Turkey’s population lived in urban areas, while 6.8% lived in rural areas.[7] The Turkish Statistical Institute (TÜİK) projects that the population will gradually expand until 2050, reaching its peak of 93.5 million that year, before falling to 89.17 million by 2075.[8]
Economy
The gross domestic product (GDP) is $802.788 billion, while per capita income exceeds $9,539.10 In 2020, the agricultural sector contributed around 6.68% to GDP, whereas 28.02% of the economic value added originated from industry and 54.20% from the service sector.[11]
Agriculture’s contribution to GDP was 12% in 1995. The decline in the agricultural sector has affected the share of agriculture in total employment, which was 29.12% in 1995 but only 18.11% in 2019 (Figure 2).
Figure 2: Employment in agriculture (1991-2019).[12]
[1] DSİ (Devlet Su İşleri), 2013. Water and DSİ. Ankara, Turkey, p. 18.
[2] FAO (Food and Agriculture Organization of the United Nations), 2009. Irrigation in the Middle East region in figures. Rome, Italy, p. 355.
[3] DSİ (Devlet Su İşleri), 2022. www.dsi.gov.tr
[4] Ozturk, M, Gucel, S, Kucuk M and Sakcali, S, 2010. ‘Forest diversity, climate change and forest fires in the Mediterranean region of Turkey.’ Journal of Environmental Biology 31: 1-9.
[5] DSİ (Devlet Su İşleri), 2022. www.dsi.gov.tr.; FAO (Food and Agriculture Organization of the United Nations), 2009. Irrigation in the Middle East region in figures. Rome, Italy, p. 355.
[6] TÜİK (Turkish Statistical Institute), 2021. www.tuik.gov.tr.
[7] TÜİK (Turkish Statistical Institute), 2021. www.tuik.gov.tr.
[8] TÜİK (Turkish Statistical Institute), 2013. Population projections, 2013-2075.
[9] TÜİK (Turkish Statistical Institute), 2022. Address-based population registration system results, 2021.
10 TÜİK (Turkish Statistical Institute), 2022. Periodic gross domestic product, IV. Quarter: October-December 2021.
[11] Statista, 2022. Turkey: Share of economic sectors in gross domestic product (GDP) from 2010 and 2020; Tarimdan Haber, 2019. What is the share of agriculture in gross domestic product?
[12] The World Bank Data, 2021. Employment in agriculture (% of total employment) (modeled ILO estimate) – Turkiye.

