Contributors
Author: Prof Thameur Chaibi is a Director of Research at the National Research Institute for Rural Engineering water and Forestry, Tunis, Tunisia. He has authored numerous publications in various areas covering renewable energy systems, water resources engineering and environment management. He is a follow of World Academy of Sciences, the African Academy of Sciences and the Islamic World Academy of Sciences
Peer reviewer: Mr Abdelkader Hamdane is a former Director General of the Rural Engineering and Water Management Department of the Ministry of Agriculture and Hydraulic Resources of Tunisia. Currently, he joined number of international research teams at academic institutes. He is a corporate member of the Tunisian Institution of Engineers, and a member of other international water organizations.
Geography and climate
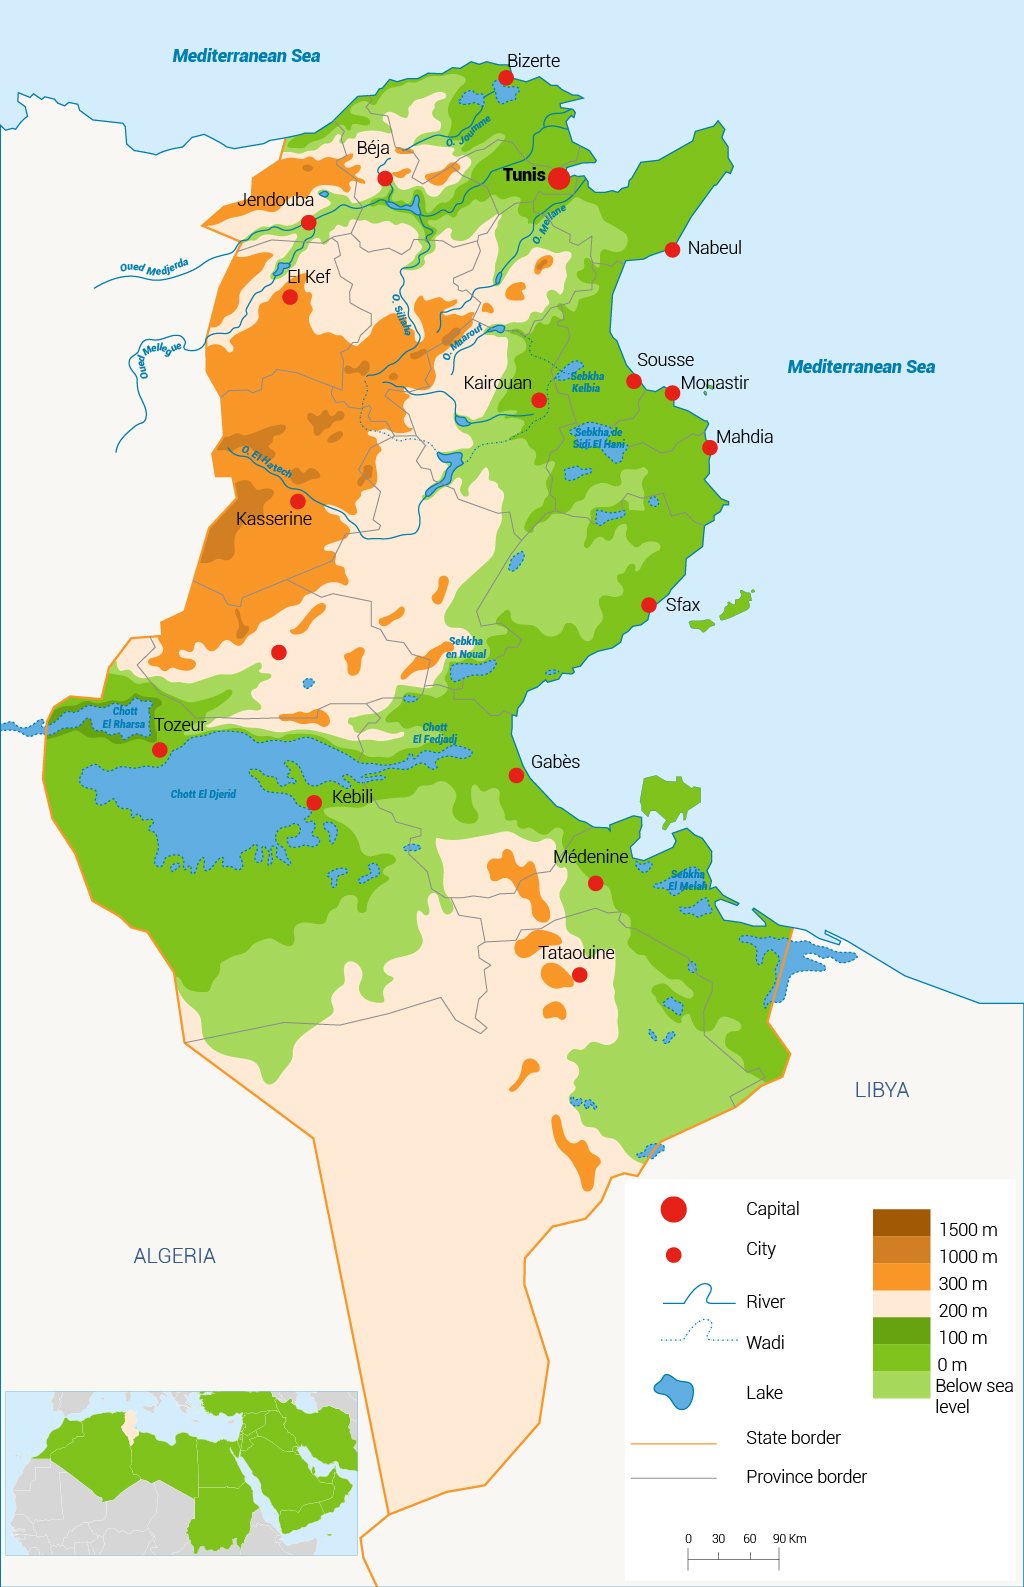
Tunisia lies in north-east Africa. It has one border of 965 km with Algeria in the west and another of 459 km with Libya in the south-east and a 1,148 km Mediterranean coastline to the north and east. Tunisia’s total area is 163,610 km2.
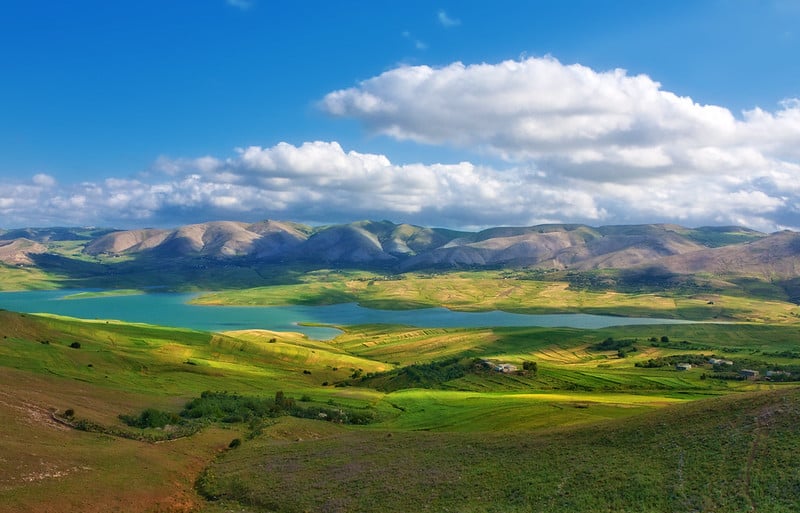
The terrain in the north is mountainous, which, moving south, gives way to a hot, dry central plain.
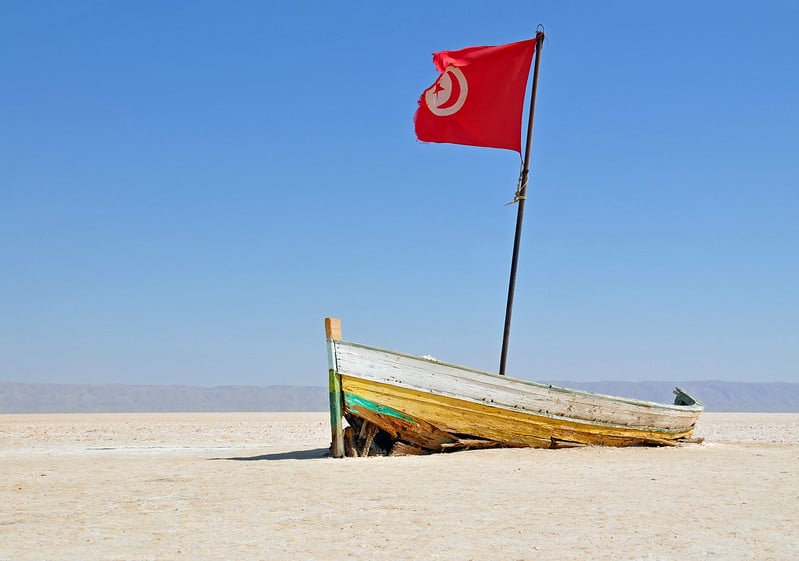
The south is semi-arid and merges into the Sahara. A series of salt lakes, known as chotts or shatts, lies in an east-west line at the northern edge of the Sahara, extending from the Gulf of Gabès into Algeria.
The lowest point is Chott el-Djerid at 17 metres below sea level and the highest is Jebel ech Chambi at 1,544 metres above sea level.
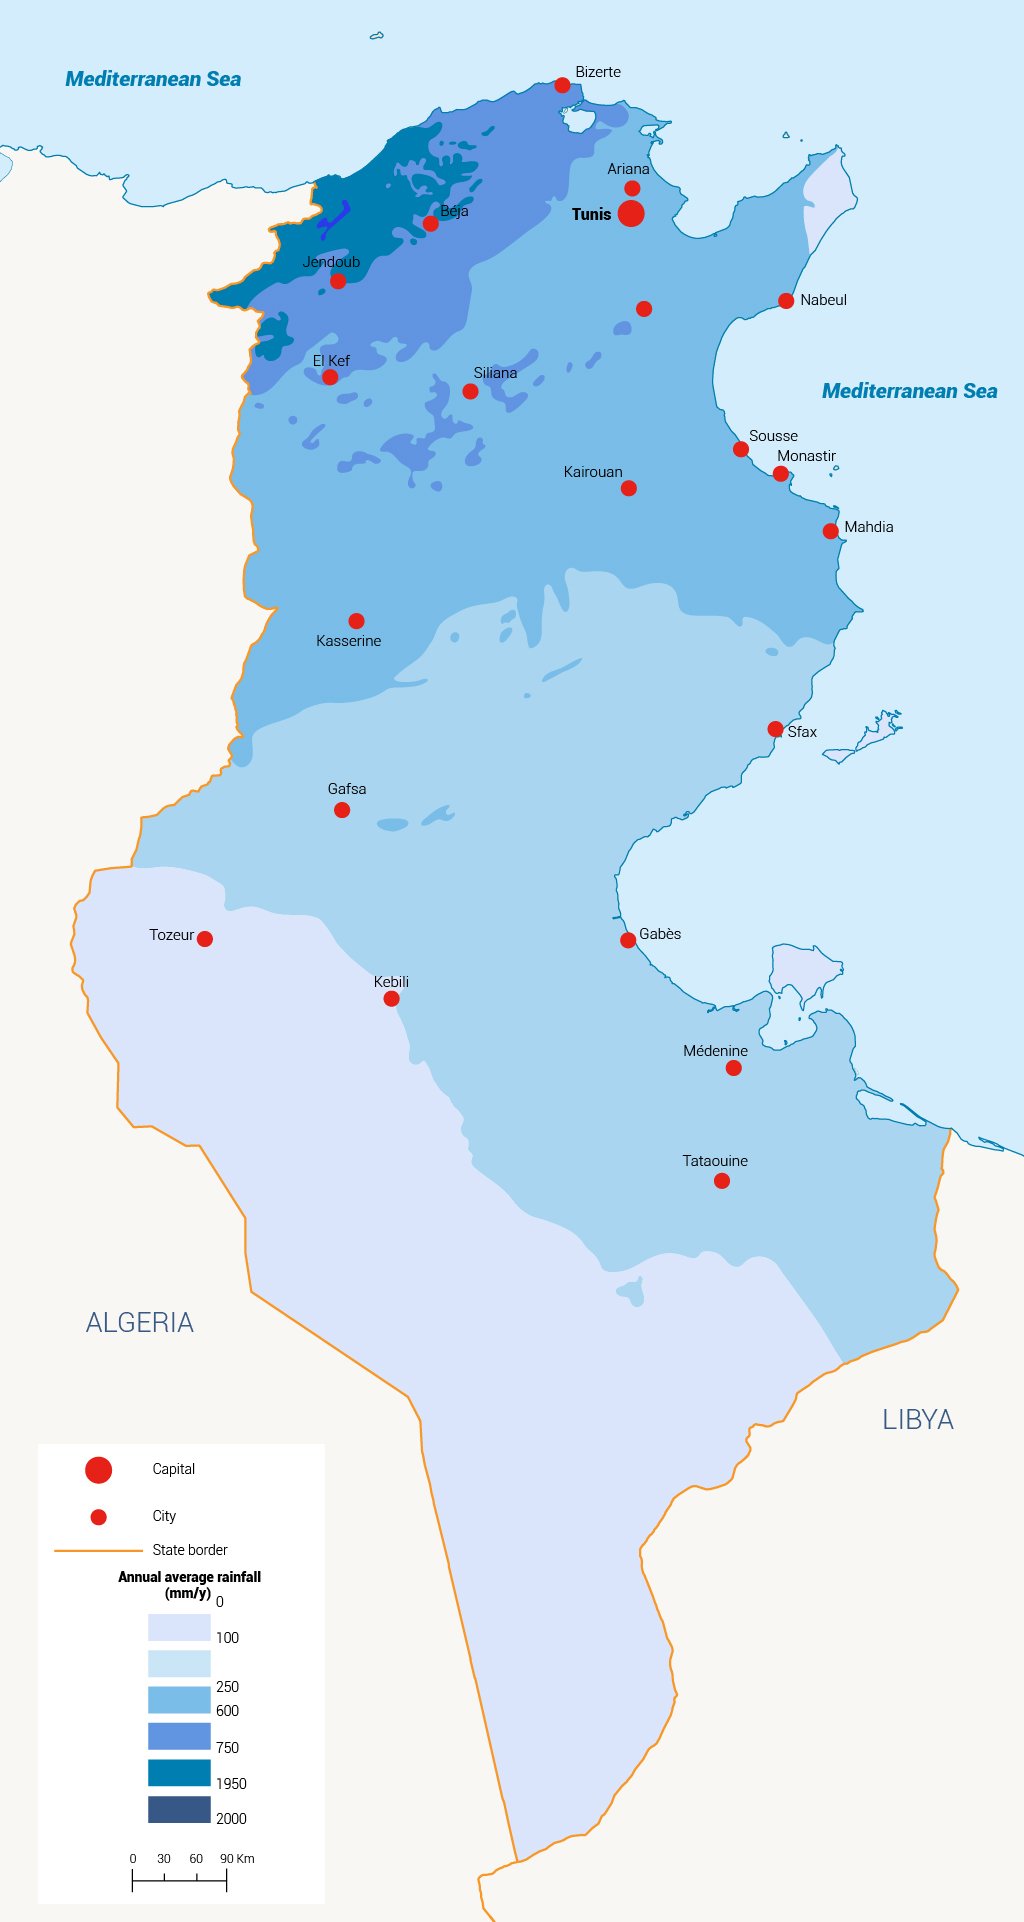
A Mediterranean-type climate prevails in the north and along the coasts, becoming semi-arid in the interior of the country and arid in the south.
Generally, summers are hot and dry while winters are mild with moderate rainfall. Temperatures in July and August can exceed 40°C when the tropical continental air mass of the desert extends across the country.[1]
Average temperatures range between 11.4°C in December and 29.3°C in July.[2]
Tunisia has an average annual precipitation of 223 millimetres (mm), and rainfall resources are estimated at 36 cubic kilometres per year (km3/yr).
Population
Tunisia’s population was estimated to be 3.6 million in 1950, 4.2 million in 1960, 5.1 million in 1970, 6.4million in 1980, 8.2 million in 1990, 9.6 million in 2000 and 11.69 million in 2019, ranking it 78th in the world for population size. It has a population density of 72.1 inhabitants per km2. Over the last 20 years, the population has experienced an average annual growth rate of about 1.2%, which is one of the lowest along the southern Mediterranean coast. The population was 69.7% urban in 2019, compared with 35.24% in 1954. The slow rate of population growth is expected to continue dropping. Current projections predict that the growth rate will peak at 1.09% in 2020, before a decline to 0.29% by 2050 and potentially to 0% over the next century.[3] These predictions mean that the population will be 11.9 million in 2020, 12.8 million in 2030, 13.4 million in 2040 and 13.9 million in 2050.[4]
Economy
Economic growth in Tunisia expanded modestly by 2% in 2017 and 2.5% in 2018 through sustained agricultural and services growth and the gradual recovery of tourism, phosphate production and manufacturing. In the medium term, economic growth is projected to pick up gradually to 3.5% in 2019-2020, against a backdrop of an improved business climate as a result of structural reforms and greater security and social stability.
Inflation was projected to increase to 6.7% in 2018, driven by the depreciation of the Tunisian dinar (TND), the VAT rate increase and the rise in prices of certain products (e.g. fuels, tobacco, telecoms), while monetary tightening and fiscal consolidation was expected to partly counteract inflationary pressures.[5]
Unemployment remained high at 15.5% in 2017 despite low labour force participation of about 50%, mainly due to weak participation by women (28%).
Most of the unemployed are low skilled, but university graduates have the highest unemployment rate, which increased from 15% in 2005 to 23% in 2010 and 31% in 2017. Unemployment rates are also much higher among women and in interior regions.
The methodology used to measure poverty was recently updated by the National Institute of Statistics to better reflect current living conditions. The official poverty rate estimate for 2015 was 15.2%, down from 20.5% in 2010 and 23.1% in 2005. Regional disparities are an enduring feature, however, with the north-west and central-west regions showing rates almost twice the national average. Inequality, as measured by the Gini index, is estimated at 30.9%, down from 36% in 2005. The dynamics of monetary indicators of welfare appear to be at odds with the perception of lower standards of living in household surveys.[6]
Between 2000 and 2010, Tunisia experienced sustained economic growth averaging 4.2%. The gross domestic product (GDP) in 2010 was TND 63.5 million. The principal economic sectors are: (i) agriculture, which accounted for 8% of GDP in 2010 and 17.7% of the national labour force; (ii) industry, including non-manufacturing industries, which accounted for 31.1% of GDP and 33% of employment nationally; and (iii) the services sector, which accounted for 60.9% of GDP, with two important subsectors: transportation, which accounted for 9% of GDP, and tourism, which accounted for 7% of GDP and covered 51% of the trade deficit for 2008.[7]
[1] Wikipedia, n.d. Geography of Tunisia.
[2] European Environment Agency, 2014. Horizon 2020 Mediterranean Report.
[3] Worldometers, 2019. Tunisia population 2019.
[4] World Population Review, 2019. Tunisia population 2019.
[5] World Bank, 2018. Tunisia’s Economic Outlook – April 2018.
[6] World Bank, 2018. Tunisia’s Economic Outlook – April 2018.
[7] European Environment Agency, 2014. Horizon 2020 Mediterranean Report.