
Contributors
Author: Eng. Wala’ Alsiekh Abdallah, MSc (Fanack Water Team) holds a Master degree in Water & Environmental Engineering, with specific focus on wastewater treatment technologies. Wala’ is involved in the research, development and review of water related studies, as well as the analysis of efforts to improve water management in the MENA-region
Peer review: Dr. Gül Özerol (Fanack Water Team) is a researcher, editor and author with a PhD in Innovation and Governance for Sustainable Development. She has lived and worked in Turkey, Germany, and the Netherlands, and has been researching water issues in the MENA-region for more than 10 years.
Introduction
Although Qatar is considered to be a water-scarce country, it has one of the highest per capita water consumption rates in the world, at around 500 litres per capita per day (L/cap./d). Massive infrastructure developments and higher standards of living are increasing water demand. Qatar depends largely on seawater desalination and groundwater abstraction, and less on treated wastewater, to meet its water needs.
The country has invested large sums in developing and implementing strategies to improve its water security, including water conservation strategies and expansion of treated wastewater reuse.
Geography and climate
Qatar covers an area of about 11,586 km2, with a maximum length of 180 km along the north-south axis and 85 km at its widest point. Qatar lies in the arid Arabian Peninsula, located on the Persian Gulf and bounded only from the south by Saudi Arabia. The elevation of the country decreases from 100 metres above sea level in the south to less than 50 metres in the north. [1]
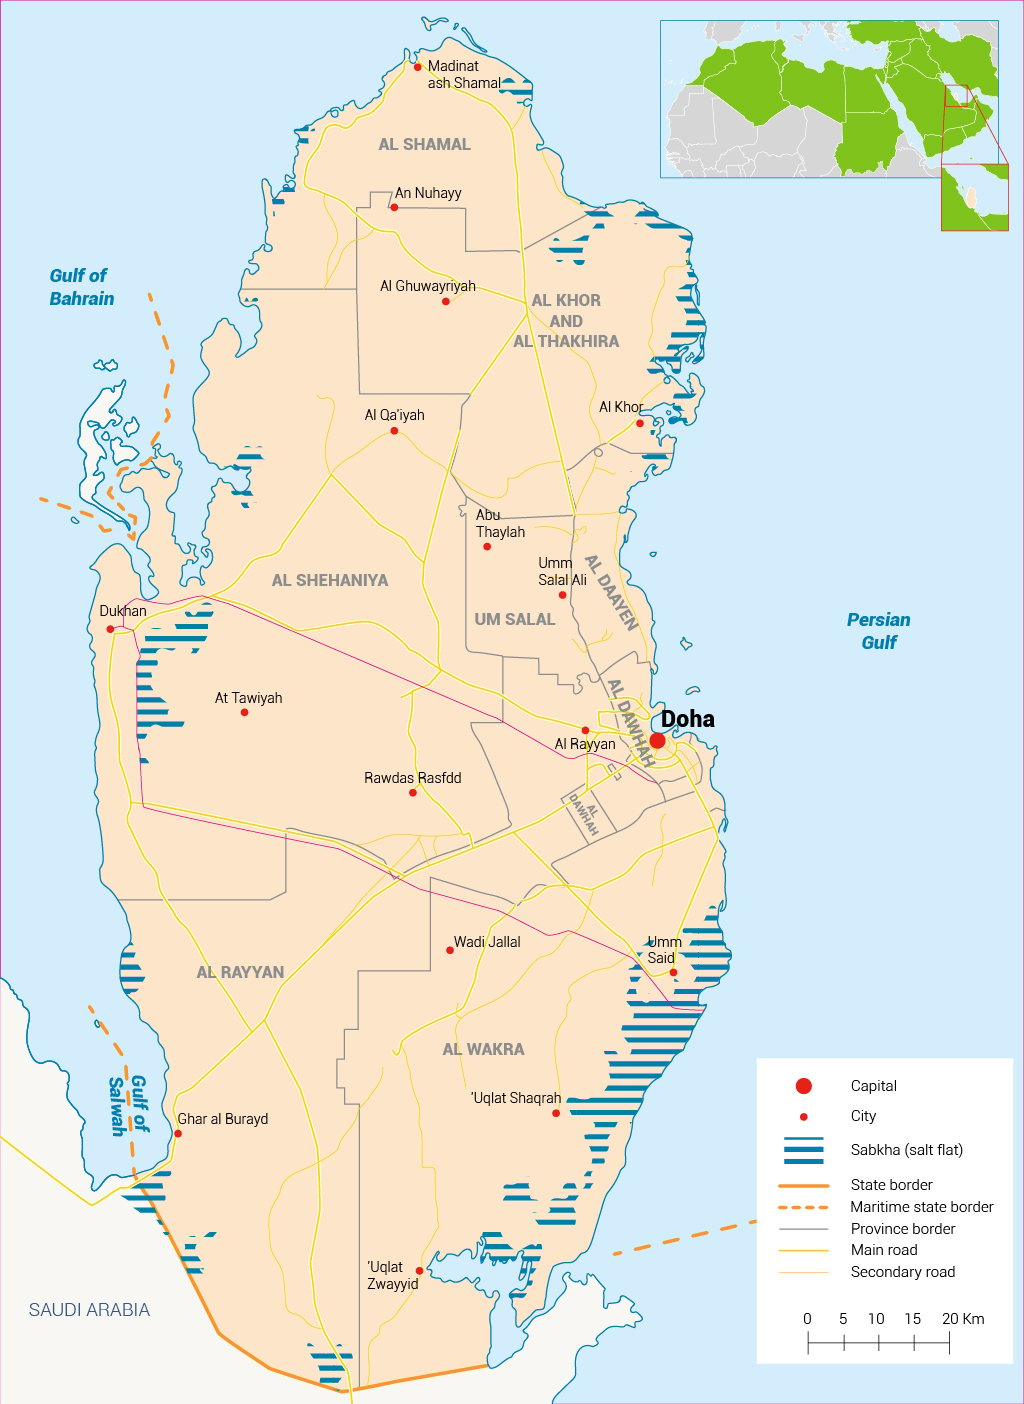
Qatar has a desert climate that is characterized by limited rainfall averaging 80 millimetres annually, high temperatures during the summer (>40 °C) and high evaporation rates of 2,200 millimetres per year (mm/yr). Evapotranspiration ranges from less than 2 millimetres per day (mm/d) in December to a maximum of 10 mm/d in June.[2] Rainfall levels between 2010 and 2017 are shown in Table 1.
Table 1: Rainfall (mm) at selected monitoring stations (2010-2017). Data source: Civil Aviation General Authority.[3]
| Station (mm) | 2010 | 2011 | 2012 | 2013 | 2014 | 2015 | 2016 | 2017 |
| Umm Said | 24.4 | 30.3 | 17.6 | 36.6 | 73 | 95.4 | 69.7 | 92.2 |
| Al-Ruwais | 33.8 | 93.8 | 40 | 98.3 | 56.5 | 82.5 | 49.8 | 129.7 |
| Dukhan | 10 | 33.8 | 35.8 | 54.7 | 44.6 | 72.1 | 66.4 | 90.8 |
| Doha International Airport | 33.1 | 70.5 | 23.9 | 41.6 | 52.4 | 114.5 | 101.1 | 78.4 |
| Al-Karaana | 27.1 | 22.0 | 32.9 | 56.3 | 53.4 | 37.5 | 33.6 | 66.2 |

Population
Qatar’s population increased from 369,079 in 1968 to 2.80 million in 2019 (Figure 1), growing at an average annual rate of 7.1% (Figure 2).[4] The most recent population census was 2,646,854 in April 2021.[5] Between 80% and 90% of the population lives in just 10% to 15% of the total geographic area of the country. Among the most populated areas, the capital Doha, al-Rayyan, Umm Slal, al-Wakra, Mesaieed, al-Khor, Ras Laffan, al-Shamal and Dukhan are important. Expats amount to around 86% of the population. [6]
Economy
In 2020, gross domestic product (GDP) was $146.37 billion.[9] Figure 3 shows the GDP growth rate between 2001 and 2020. GDP per capita (current $) increased from $29,976 in 2000 to $50.805 in 2020. [10]
In 2016, oil and gas contributed about 49.5% of GDP (in 2013 constant prices), the electricity and water sectors contributed nearly 0.5% of GDP, while the contribution of the agriculture, livestock and fishery sectors was only around 0.1% of GDP.
Over the period 2011-2016 (in 2013 constant prices), the electricity, water and treated wastewater sectors contributed approximately 0.4% of GDP and 1.2% of total employment.[11]
Figure 3: Annual GDP growth rate (%) (2001-2020).[12]
[1] FAO Aquastat, 2008. Qatar.
[2] Ibid.
[3] Planning and Statistics Authority, 2017. Water Statistics in the State of Qatar 2017.
[4] Islamic Development Bank, n.d. Health, nutrition and population statistics.
[5] Planning and Statistics Authority, 2021. Qatar census 2021.
[6] Available at: https://www.go-gulf.qa/expats-in-qatar-statistics-and-trends-infographic/.
[7] Planning and Statistics Authority, 12019. Population and Social Statistics.
[8] The World Bank DataBank, n.d. Health, nutrition and population statistics.
[9] The World Bank DataBank, n.d.
[10] Ibid.
[11] Ministry of Development Planning and Statistics, 2017. Qatar in Figures, 32nd issue.
[12] The World Bank DataBank, n.d.