
There are no fresh surface water resources in Qatar, which makes rainfall and groundwater recharge the main freshwater resources. The country’s major water resources are desalination, groundwater and reuse of treated sewage effluent (TSE) (Figure 1).
The total water production from these three resources rose from 220 million cubic metres (MCM) in 1990 to 912 MCM in 2016, and to 1038.16 MCM in 2019. 1 2
Figure 1: Breakdown of Qatar’s water resources. 3
Groundwater
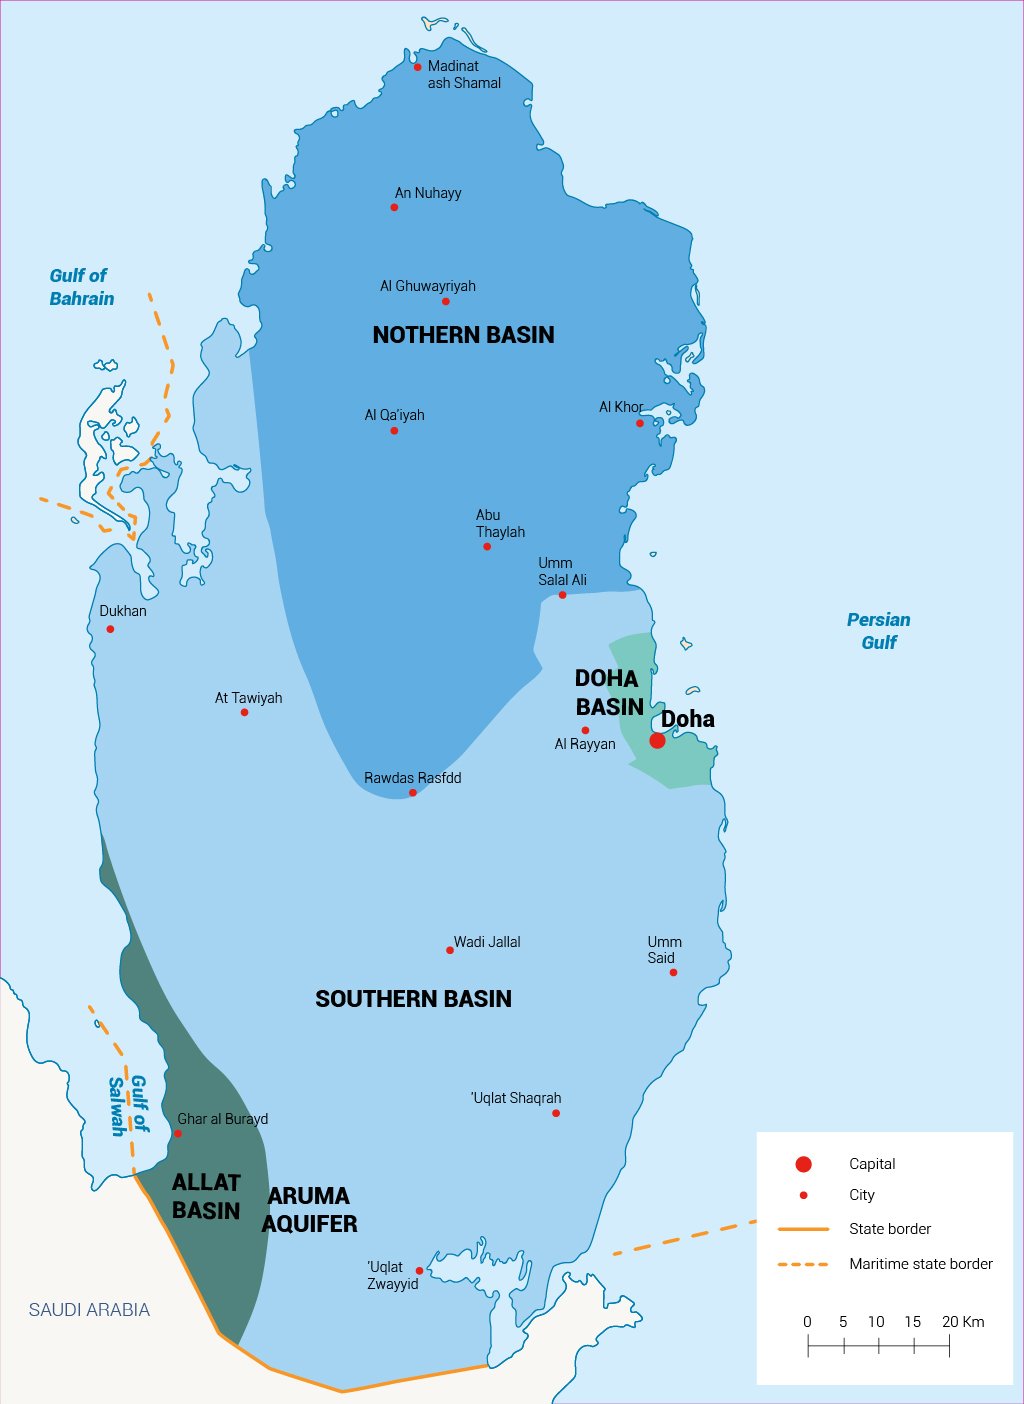
Qatar has two main groundwater resources, namely the Rus and Umm er Rhaduma aquifers. Rainfall recharge contributes 43.4% of the groundwater reserve. The inflow from Saudi Arabia, which originates from a shared artesian aquifer, contributes 2%, while the artificial recharge from TSE contributes 54.6%.[4] As shown in Map 1, Qatar has four main groundwater basins, namely the Northern Basin, Southern Basin, Doha Basin and Allat Basin. Table 1 shows the natural long-term water balance of Qatar’s groundwater resources between 1998 and 2016.
Groundwater abstraction, which currently meets 30% of the total water demand, is above recharge rates.[5] In 2017, groundwater abstraction reached 250.8 MCM/yr, while the safe yield amounted to 55.8 MCM/yr,[6] causing depletion of aquifers, seawater intrusion and increased salinity. About 230 MCM/yr of water abstracted from groundwater – or around 92% of the total withdrawal – is used for agricultural purposes. During the period 2008-2016, the annual water deficit, which was mainly caused by groundwater abstraction, ranged from 97 MCM/yr to 158 MCM/yr.[7]
Table 1: Natural water balance of Qatar’s aquifers (annual average 1998-2016).[8]
| No | Water balance | MCM/year | Data source |
| 1 | Recharge of aquifers from rainfall | 71.6 | kahramaa and Ministery of Municipality and Environment (Long-term annual average 1998-2017) |
| 2 | Inflow from Saudi Arabia | 2.2 | Al Dour Zone (Long-term annual average 2006) |
| 3 | Total renewable water resources | 73.8 | Total (1+2) |
| 4 | Groundwater outflow into sea and deep saline aquifers | 18.0 | kahramaa and Ministery of Municipality and Environment (Long-term annual average 1998-2017) |
| 5 | Average annual water balance (groundwater safe yield) | 55.8 | Subtraction (3+4) |
Non-conventional water resources
To supplement the limited conventional water resources under population and economic stress, Qatar is increasingly relying on non-conventional water resources to meet its water demand. These resources mainly comprise desalinated seawater and treated wastewater.
Desalination
Desalinated seawater supplies at least 50% of the country’s water.9 It is largely used for municipal and industrial purposes, currently meeting around 99% of the domestic water needs. In 2015, desalinated water amounted to 533 MCM, compared to 362 MCM in 2010.10 While in 2019, the gross water supplied by desalination amounted to 671 MCM. 11
Qatar has invested in and built several desalination plants across the country, with an installed capacity of around 2.27 MCM/d. Table 1 (water infrastructure in Qatar) summarizes all the independent desalination plants in operation as of 2016.
The production of desalinated water is associated with the generation of brine solution, which causes serious environmental problems. Additionally, desalination depends partially on oil and gas for energy, which also causes multiple environmental impacts. For more information on this issue, please refer to the section ‘Water Challenges in Qatar’.
Wastewater reuse
In addition to desalination, treated wastewater has been a significant non-conventional water resource in Qatar since its introduction in 2004.12 According to the Ministry of Development, Planning and Statistics, 50% of wastewater is collected, 60% of which is treated at a basic level.13 In 2019, the amount of treated wastewater reached 276 MCM (around 99.3% of the total wastewater collected).14 As Figure 2 shows, treated wastewater is used in agriculture, landscaping and parks, for deep injection into aquifers or discharge into lagoons.
Figure 2: Uses of treated wastewater. 15
Treated wastewater also plays a prominent role in cooling industries. It is estimated that these industries consume nearly 73 MCM of treated wastewater, which represents 17% of total treated wastewater demand in 2020.16 The Second National Development Strategy (NDS-2), which covers the period 2018-2022, aims to expand wastewater reuse as well as the development of water management to increase efficient water use in industrial zones.
1 Planning and Statistics Authority, 2017. Water Statistics in the State of Qatar 2017.
2 Planning and Statistics Authority, 2019. Infographics of water statistics in Qatar 2019.
3 Ibid.
4 Planning and Statistics Authority, 2017. Water Statistics in the State of Qatar 2017.
5 Ministry of Development Planning and Statistics, 2017. Water Statistics in the State of Qatar 2015.
6 Planning and Statistics Authority, 2017. Water Statistics in the State of Qatar 2017.
7 Ibid.
8 Ibid.
9 Ismail H, 2015. Food and Water Security in Qatar: Part 2 – Water Resources. Global Food and Water Crises Research Programme.
10 Ministry of Development Planning and Statistics, 2018. Qatar Second National Development Strategy: 2018-2020.
11 Planning and Statistics Authority, 2019. Infographics of water statistics in Qatar 2019.
12 Planning and Statistics Authority, 2017. Water Statistics in the State of Qatar 2017.
13 Ismail H, 2015. Food and Water Security in Qatar: Part 2 – Water Resources. Global Food and Water Crises Research Programme.
14 Planning and Statistics Authority, 2019. Infographics of water statistics in Qatar 2019.
15 Planning and Statistics Authority, 2019. Infographics of water statistics in Qatar 2019.
16 Ashghal, 2014. Treated Sewage Effluent Networks in Qatar. District Cooling Workshop, 18 June 2014.