
Marine water quality
Exposure to multiple sources of discharge negatively affects Qatar’s marine environment, including hot cooling water from industrial zones, brine from power and desalination plants that has almost twice the salinity of seawater, and surface runoff on the Doha Corniche, which drains nearly 75 MCM/yr. The discharged water is heavily polluted with organic and inorganic compounds. High concentration of these compounds affects the types and characteristics of the marine environment and causes marine life to migrate. Other point sources, such as power plants, desalination plants, ships that discharge ballast water and petrochemical industries, pose additional threats to marine water quality.[1]
Groundwater quality
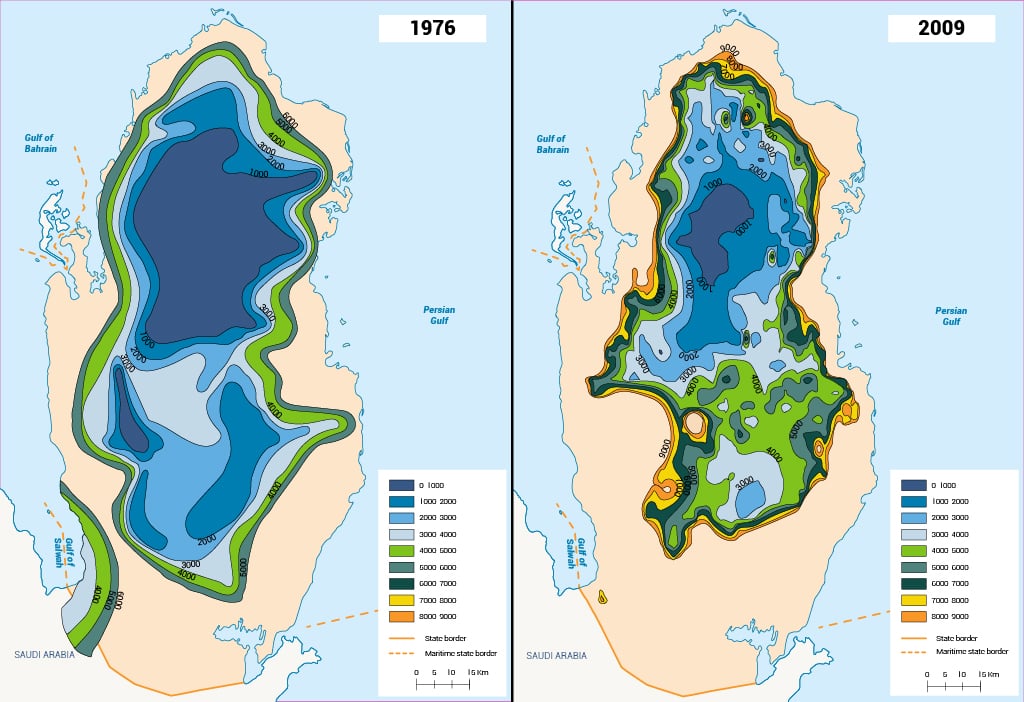
The salinity level of groundwater is the key concern regarding water quality in Qatar. Groundwater quality has deteriorated due to seawater intrusion and the inflow of brackish and saline water from lower layers underneath the fresh groundwater lenses. Map 1 illustrates the contour of total dissolved solids (TDS) in groundwater as a salinity indicator for the years 1971 and 2009. As shown, the TDS level of the northern and central aquifers varies from 500 to 5,000 milligrams per litre (mg/L) and reaches 10,000 mg/L near the shoreline.[2]
According to the FAO salinity classification, all groundwater wells in Qatar were classified as medium saline during the period 1998-2014. The percentage of high-saline wells declined from 17% in 1998 to 16% in 2016. The highest percentage of wells with slightly saline water (the lowest salinity class that can be found in Qatar) is in the Doha, South Qatar and North Qatar aquifers, whereas the highest percentage of high-salinity wells is found in the Wadi al-Urayq and al-Mashabiya aquifers as well as in South Qatar.[3]
Table 1 shows the salinity trend by conductivity in deciSiemens per metre (dS/m) and total dissolved solids in parts per million (TDS in ppm) for the al-Mashabiya, South Qatar, Central Qatar and North Qatar aquifers. It should be noted that over the entire period 1998-2014, all four aquifers were moderately saline but with a constantly rising salinity (conductivity). TDS was found to be decreasing slightly in al-Mashabiya, Central Qatar and South Qatar.[4]
Table 1: Observations of salinity indicators (TDS and electrical conductivity) in Qatar’s aquifers (1998-2014).[5]
| Aquifer | Conductivity (ds/m) Min | Conductivity (ds/m) Max | Conductivity (ds/m) Trend | TDS (ppm) Min | TDS (ppm) Max | TDS (ppm) Trend |
| Al-Mashabiya | 5.70 | 11.91 | Increasing | 3,780 | 7,368 | Slightly decreasing |
| North Qatar | 3.32 | 15.36 | Increasing | 2,420 | 9,210 | Increasing |
| Central Qatar | 4.25 | 6.01 | Slightly decreasing | 2,550 | 3,610 | Slightly decreasing |
| South Qatar | 5.03 | 7.75 | Increasing | 3,205 | 4,580 | Slightly decreasing |
[1] Ministry of Development Planning and Statistics, 2018. Qatar Second National Development Strategy: 2018-2020.
[2] Baalousha H M and Ouda O K M, 2017. Domestic water demand challenges in Qatar. Arabian Journal of Geosciences, 10: 537.
[3] Planning and Statistics Authority, 2017. Water Statistics in the State of Qatar 2017.
[4] Ibid.
[5] Planning and Statistics Authority, 2018. Water Statistics in the State of Qatar.