Current and projected water use per sector and the analysis of deficit
The figure below illustrates the different categories of water use in 2012. As can be seen, agriculture is the dominant water consumer, with 87% of all water use, and hence the major contributor to the current deficit in the water balance, which has led to groundwater mining and to many springs drying up.
The average annual renewable water resources were estimated at around 16BCM between 1992-2012. The national deficit was estimated to be on average 1.25BCM in the same period, which is an overuse of almost 20% of the renewable water resources.
Figure 1. Water use per categories.
Figure 2. Projected water use per category.
Table 1. Water balance over 1992-2012 (MCM).
| Hydraulic year | Total available water | Total water use | Deficit |
| 1992-1993 | 12705 | 12769 | -64 |
| 1995-1996 | 11716 | 13964 | -2248 |
| 1999-2000 | 12778 | 14989 | -2211 |
| 2000-2001 | 13725 | 15557 | -1832 |
| 2004-2005 | 15975 | 18887 | -2912 |
| 2005-2006 | 15970 | 18844 | -2874 |
| 2010-2011 | 18306 | 17544 | 762 |
| 2011-2012 | 19151 | 17757 | 1394 |
| Average | 14932.3 | 16174 | -1241.7 |
Table 2. Projected water demand in 2050.
| Water Basin | Domestic (MCM) | Agriculture (MCM) | Industry (MCM) | Total (MCM) |
| Barada & awaj basin | 559 | 625 | 71 | 1255 |
| Orontes Basin | 605 | 2033 | 504 | 3142 |
| Steppe Basin | 82 | 109 | 21 | 212 |
| Dajleh & Khabour Basin | 216 | 4223 | 24 | 4463 |
| Coast Basin | 180 | 491 | 96 | 767 |
| Al-Yarmouk Basin | 247 | 190 | 69 | 506 |
| Euphrates | 1260 | 6485 | 328 | 8073 |
| Total | 3149 | 14156 | 1113 | 18418 |
Projected water use for 2050
It is expected that climate change will have a severe impact on water resources in Syria, decreasing the total water available per year by 32% in 2050. At the same time, the demand for water will increase by 15% as a result of economic development and population growth.[1] This, in turn, will increase the total deficit to more than 6BCM annually for the base scenario, .
Agricultural water use and irrigation development
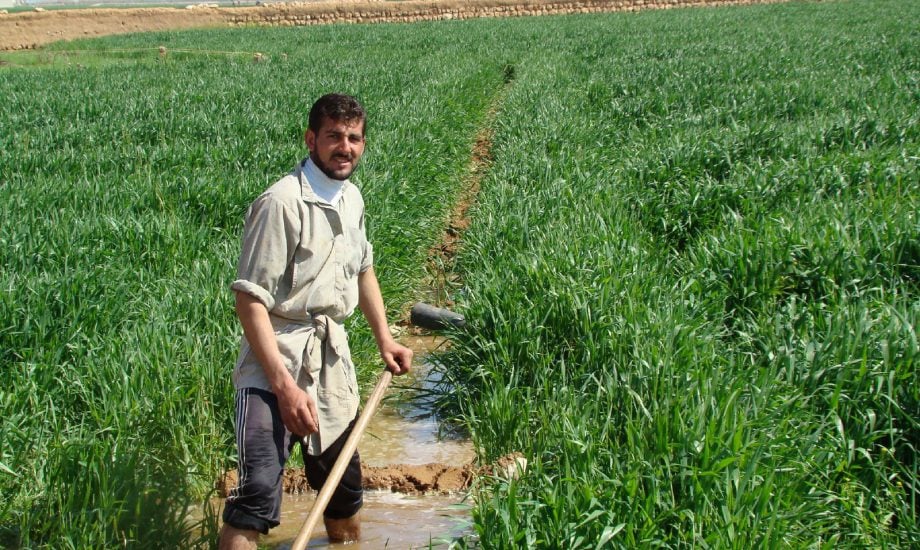
Agriculture is one of the key economic sectors in terms of contribution to GDP, employment – both direct and indirect in e.g. the transport sector – balance of trade, food security and raw materials for agro-manufacturing and food processing. The private sector makes the lion’s share (98.5%) of total agricultural investments (cooperatives are considered part of the private sector), compared to 1% by the joint sector and 0.5% by the public sector.
Syria has a total irrigated area of approximately 1.5 million ha (out of a total 5.3 million cultivated ha), most of which is situated in the valleys around the Euphrates River. Public schemes run by the government but implemented by individuals account for 550,000 ha or just over a third of the total. Some schemes are gravity fed but most are irrigated with pumped water. Before the war, about 60-70% of the irrigated area was supplied with groundwater and about 25% through government-run surface water irrigation schemes. Unlicensed wells represented about 57% of the total 215,000 wells. Modern irrigation methods (sprinkler and drip irrigation) were still at an early stage of implementation, accounting for about 360,000 ha (24%).
[1] Mourad, K. and Berndtsson, R. 2012. ‘Water Status in the Syrian Water Basins’. Open Journal of Modern Hydrology 2(1):15-20.
