Contributors:
Author: Prof. Waleed Al- Zubari is Professor of Water Resources Management at the Department of Natural Resources and Environment, College of Graduate Studies, Arabian Gulf University (AGU), Bahrain. He serves as the Coordinator of the Water Resources Management Program, College of Graduate Studies, and of UN Water Learning Center for the Arab Region at the AGU.
Peer reviewer: Dr. Mohamed Dawoud is Professor at National Water Research Center, Egypt and at Present he is Water Resources Advisor at Environment Agency – Abu Dhabi, UAE.

Geography and Climate
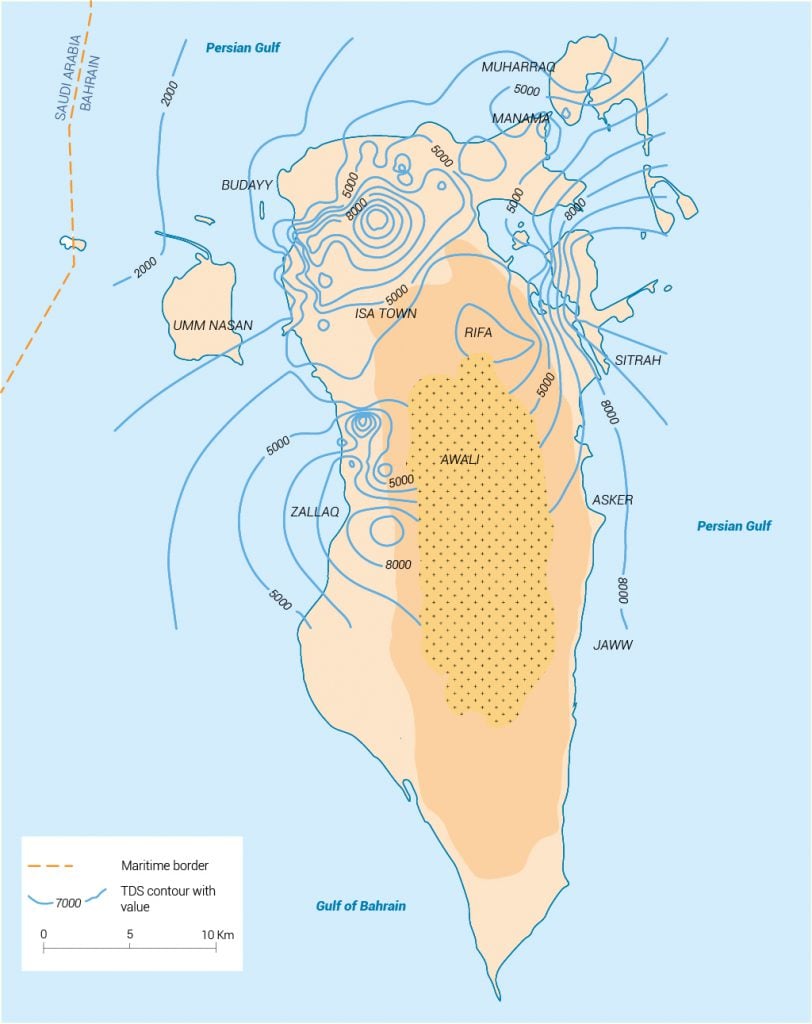
The Kingdom of Bahrain is located in the west central part of the Arabian Gulf, roughly midway between Saudi Arabia to the west and Qatar to the east (map 1). It is an archipelago of more than 36 islands, shoals and small islets that vary considerably in size and structure. Due to Bahrain’s limited land area, government policy has encouraged land reclamation to accommodate development. Between 1964 and 2015, land area increased by almost 117 square kilometres (km2), from 663 km2 to 780 km2, or about 18%.[1] Most of this reclaimed land is on the northern built-up portions of the main island, Bahrain Island.
Bahrain has an arid to extremely arid climate. It is characterized by very hot summers and relatively mild winters. Mean air temperature fluctuates between 14oC and 41oC. There are two seasons: winter extends from November to April and summer lasts for the rest of the year. January is the coldest month while the temperature peaks in August. Bahrain has erratic, scanty rainfall that exhibits high spatial and temporal variability (Figure 1) and averages about 80 millimetres per year (mm/yr), while evaporation exceeds precipitation by more than tenfold most of the year. Mean monthly relative humidity is about 67%, with the mean daily maximum ranging from 78% to 88%.
Figure 1: Recorded annual rainfall (mm) at Bahrain International Airport on Muharraq Island, 1948-2017. Data Source: Meteorological Directorate, Bahrain.

Population
In the last four decades, Bahrain has seen its population grow dramatically from about 0.35 million in 1980 to about 1.5 million in 2018 (Figure 2). The official projection for the population in 2035 is about 2.4 million. Population growth is influenced by two key factors. First, improving socio-economic conditions have encouraged the growth of the native Bahraini population.
Second, Bahrain’s increasingly diversified economy has produced demand for skilled labour, particularly within the industrial and service sectors, which has attracted foreign workers. Currently, expatriates slightly exceed the number of citizens (51%).
Figure 2: Bahrain’s population growth, historical (1940-2010) and projected (2020-2030). Source: Information and eGovernment Authority.
Economy
Over the past ten years, economic growth has been relatively strong. From 2008 to 2018, gross domestic product (GDP) in current prices grew a total of about 150%, with an average annual growth rate of 6% per year (Figure 3 and 4). This is primarily due to the expansion in the financial, manufacturing and construction sectors, which is in line with Bahrain’s Economic Vision 2030 aimed at fostering a private sector-driven economy largely independent of oil. To grow its economy, Bahrain has been encouraging investment in new sectors such as tourism, business services, manufacturing, logistics and export-oriented industries such as aluminium. Figure 5 shows the main sectors and their contribution to GDP. In 2018, GDP was about $38.3 billion.
The International Monetary Fund (IMF) forecasts that GDP will reach about $48.4 billion by 2024. Similarly, per capita GDP share has been increasing steadily, from about $40,860 in 2008 to about $50,060 in 2018 (2.1% average annual growth), and is expected to reach about $57,870 by 2024.
Figure 3: Bahrain’s GDP, 1980-2018. Source: IMF Data Mapper.
Figure 4: Bahrain’s GDP per capita, 1980-2018. Source: IMF Data Mapper.
Figure 5: Percentage contribution to GDP by type of economic activity at current prices by industry, 2017. Source: National Accounts Annual Report 2017.
[1] Bahrain in Figures 2016. Information and eGovernment Authority.